The other day I stumbled onto Dmitry Sokolov’s ‘How OpenGL works’ series, about implementing your own software 3D renderer which functions kind of like OpenGL. I decided to give it a go myself, and maybe write some posts detailing the journey. In part 1 we get set up and get some pseudo wireframe rendering going. You can check out the results, then read on to find out how it’s done.
Source Code
If you want to follow along, just download and unzip the code for this part. I’ll briefly go over the contents before we proceed:
- index.html - The file containing the main code for this part. Our source code will be inside this HTML in an inline script tag, at least for now.
- teapot.obj - A 3D teapot model I nabbed off the internet.
- serve.bat - A batch file which, assuming you have Python installed and in your PATH, starts a server at
http://127.0.0.1:12345, necessary because otherwise usingXMLHttpRequestto load files won’t work. If you have Python 2.x, this will work, but if you’re running 3.x you should replace ‘SimpleHTTPServer’ with ‘http.server’. - misc.js - This contains some helper code that isn’t that interesting to cover for what we’re doing, including:
- IO module - Contains the
Fileclass which lets us load files usingXMLHttpRequest, in bulk and using a queue if necessary. - debugMode function - Lets us turn alerts for errors with nicely formatted stack traces on and off.
- usingModule function - Takes an object and adds all its properties to the window object so we can use for instance
new File("teapot.obj")instead ofnew IO.File("teapot.obj").
- IO module - Contains the
And because I’m a crotchety C# programmer at heart I’ll be using ECMAScript 6’s new class keyword and features, which means that this will run in recent versions of Firefox, Chrome, and Edge 13 and basically nothing below that. Sorry not sorry.
Preparing the Canvas
First things first, we need a canvas to draw into, so we get that ready.
<canvas id="canvas" moz-opaque style="border: 1px solid black"></canvas>Pretty simple. Just a canvas element, with the mind bogglingly original id of canvas, the property moz-opaque for some performance enhancements in browsers that support it since we don’t care about seeing what’s below the canvas, and a 1 pixel black border.
First we want a program entry point. In my experience it’s best to run your JavaScript program on load, so I create the following code:
// main function called on load
function run() {
  // set our canvas size
  var canvas = document.getElementById("canvas");
  canvas.width = 800;
  canvas.height = 480;

  // clear our canvas to opaque black
  var context = canvas.getContext("2d");
  context.fillStyle = "black";
  context.fillRect(0, 0, canvas.width, canvas.height);

  // get image data for direct pixel access
  var imageData = context.getImageData(0, 0, canvas.width, canvas.height);
}

// turn on debug mode so errors throw up an alert
// containing error information and stack trace
debugMode(true);

// run our program when the document's loaded
document.body.onload = run;
Inside the run function we get our canvas by its id, and set the width and height, as well as create a 2d rendering context. Then, for good measure and since not all browsers support moz-opaque, we clear it to black just to be sure. Finally we store our canvas’ image data so we can pass it around to our custom drawing functions later.
Note that the debugMode function is one of our helper functions from misc.js. If you’re following along, make sure to include this in the head section of your file using <script src="misc.js"></script>.
Bresenham’s Line Drawing Algorithm
This is what part 1 of the lessons I’m following covers. However, I already had this implemented, and just reused/rewrote the C# code I already had to implement this. Other people are far more qualified to cover Bresenham’s algorithm, so I won’t go into detail on how it actually works. I will however, provide the code that does the drawing.
// draws a line using Bresenham's line algorithm (integer version)
function drawLine(imageData, x0, y0, x1, y1) {
  // convert all coordinates to integers
  x0 |= 0;
  y0 |= 0;
  x1 |= 0;
  y1 |= 0;

  // get binary pixel data array
  var data = imageData.data;

  var steep = Math.abs(y1 - y0) > Math.abs(x1 - x0);
  if (steep) {
    var tmp;
    tmp = x0; x0 = y0; y0 = tmp;
    tmp = x1; x1 = y1; y1 = tmp;
  }

  var yStep;

  if (x0 > x1) {
    var tmp;
    tmp = x0; x0 = x1; x1 = tmp;
    tmp = y0; y0 = y1; y1 = tmp;
  }

  if (y0 < y1) {
    yStep = 1;
  }
  else {
    yStep = -1;
  }

  var deltaX = x1 - x0;
  var deltaY = Math.abs(y1 - y0);
  var error = 0;

  var index = 0;
  var y = y0;
  for (var x = x0; x <= x1; x++) {
    // index is vertical coordinate times width, plus horizontal coordinate,
    // times 4 because every pixel consists of 4 bytes
    if (steep) {
      index = (x * imageData.width + y) * 4; // y, x
    }
    else {
      index = (y * imageData.width + x) * 4; // x, y
    }

    // set RGBA values to 255 producing opaque white pixel
    data[index] = data[index + 1] = data[index + 2] = data[index + 3] = 255;

    error += deltaY;
    if ((error << 1) >= deltaX) {
      y += yStep;
      error -= deltaX;
    }
  }
}
We pass it an ImageData instance, which we got from our canvas already, as well as the coordinates to draw from and to, and this draws an aliased 1 pixel thick white line. Note that Bresenham’s line algorithm can use only integers for added performance, which this version does. In order to make that work we have to convert the coordinates to integers, so we do that. Then we get the pixel data from our imageData using its data property, which is a Uint8ClampedArray instance, or an array of width times height times 4 unsigned 8-bit integers with values between 0 and 255 inclusive. We’ll be using this to write directly to the pixels.
When we want to draw a pixel we determine its starting position inside this array and set all 4 bytes to 255, which creates a full opaque white pixel. Ideally you’d want to be able to specify the color of the pixels, but right now we’re just trying to get up and running so this will do. Now we can render a line to our canvas using the following code in our run function:
  // draw line from (10, 10) to (100, 30)
  drawLine(imageData, 10, 10, 100, 30);
At this point we could theoretically render a model, if we had one, so that’s our next step.
Loading and Parsing the Model
Loading files inside an HTML file is a right pain in the ass. The way its usually done is using XMLHttpRequest, which can fetch other documents either synchronously or asynchronously, although the former is discouraged, so we don’t want to do that. Fortunately our IO module in misc.js has us covered with the IO.File class, which lets us queue up any number of files to load, and letting us know when it’s done. We modify our earlier run function to do this like so:
// add all properties on the IO object to the window object
// so they can be used without prefixing "IO."
usingModule(IO);
var model = null;

// main function called on load
function run() {
  // loads list of files asynchronously, calls function when done
  File.loadFiles(
    function(files) {
      // parse our teapot obj model file
      model = parseObj(files[0].value);
      // start main program
      start();
    },
    "teapot.obj"
  );
}

function start() {
  // set our canvas size
  var canvas = document.getElementById("canvas");
  canvas.width = 800;
  canvas.height = 480;

  // clear our canvas to opaque black
  var context = canvas.getContext("2d");
  context.fillStyle = "black";
  context.fillRect(0, 0, canvas.width, canvas.height);

  // get image data for direct pixel access
  var imageData = context.getImageData(0, 0, canvas.width, canvas.height);
}
The IO.File.loadFiles function takes a function to call when done loading the files, and then a list of items which can either be an URI string, or an array containing an URI string and a type string. Since the default way to load is as a plain-text file, we can just supply our "teapot.obj" string directly. Once our file is loaded our function will be called with a list of files in the order we supplied them, so files[0] will be an instance of IO.File, and if all is well its value property will have the text we need, which we pass to a parseObj function that we will create shortly.
Once everything’s loaded and the model’s been parsed we call a new start function, which contains the code that was in our run function before. Of course we need to actually parse the model file. Fortunately the obj format is pretty easy to follow. For example:
v 0 0 0
v 2 0 0
v 2 3 0
f 1 2 3
This describes a 3D ‘model’, with three vertices and one face (or triangle). Every line that starts with ‘v’ describes a vertex, with its X, Y, then Z coordinates. Every line that starts with ‘f’ describes a single triangle, with the three numbers describing the indices of the vertices in order. For some reason the obj file format decided that the first declared vertex starts at index 1, not 0, so be careful of that. A face declaration can also have negative indices, in which case -1 refers to the last vertex specified so far, -2 to the second to last, and so on.
With this knowledge we can write our parseObj function to get the vertices and faces that make up our model:
// parses an obj file from a text string
function parseObj(text) {
  var verts = [];
  var faces = [];

  // split the text into lines
  var lines = text.replace('\r', '').split('\n');
  var count = lines.length;

  for (var i = 0; i < count; i++) {
    var line = lines[i];

    if (line[0] == 'v') {
      // lines that start with 'v' are vertices
      var tokens = line.split(' ');
      verts.push({
        x: parseFloat(tokens[1]),
        y: parseFloat(tokens[2]),
        z: parseFloat(tokens[3])
      });
    }
    else if (line[0] == 'f') {
      // lines that start with 'f' are faces
      var tokens = line.split(' ');
      var face = [
        parseInt(tokens[1], 10),
        parseInt(tokens[2], 10),
        parseInt(tokens[3], 10)
      ];
      faces.push(face);

      if (face[0] < 0) {
        face[0] = verts.length + face[0];
      }
      if (face[1] < 0) {
        face[1] = verts.length + face[1];
      }
      if (face[2] < 0) {
        face[2] = verts.length + face[2];
      }
    }
  }

  // return an object containing our vertices and faces
  return {
    verts: verts,
    faces: faces
  };
}
There’s really nothing shocking here. We loop through all the lines in our text, if a line starts with ‘v’ we push a vertex into our array of vertices, if it starts with ‘f’ we push a face into the faces array containing the vertex indices. Once we’ve gone through all the lines we return an object containing our vertex and face arrays.
Rendering the Model
Now we’re finally ready to render our model! We add the following code to the end of our start function:
  // some drawing positioning
  var centerX = canvas.width / 2.0;
  var centerY = canvas.height / 2.0;
  var scale = 100;
  centerY += 150;

  // draw our model
  for (var i = 0; i < model.faces.length; i++) {
    var face = model.faces[i];
    var v0 = model.verts[face[0] - 1];
    var v1 = model.verts[face[1] - 1];
    var v2 = model.verts[face[2] - 1];

    if (v0 && v1 && v2) {
      drawLine(imageData, centerX + v0.x * scale, centerY - v0.y * scale, centerX + v1.x * scale, centerY - v1.y * scale);
      drawLine(imageData, centerX + v1.x * scale, centerY - v1.y * scale, centerX + v2.x * scale, centerY - v2.y * scale);
      drawLine(imageData, centerX + v2.x * scale, centerY - v2.y * scale, centerX + v0.x * scale, centerY - v0.y * scale);
    }
    else {
      if (!v0) { console.log("Vertice " + (face[0] - 1) + " not found!"); }
      if (!v1) { console.log("Vertice " + (face[1] - 1) + " not found!"); }
      if (!v2) { console.log("Vertice " + (face[2] - 1) + " not found!"); }
    }
  }

  // write our new pixels to the canvas
  context.putImageData(imageData, 0, 0);
First we set up some variables that lets us position where we draw onto the canvas. We want to center our drawing, so we calculate the center X and Y coordinates. The teapot we’re rendering is kinda small though, so we’ll just multiply all coordinates by a scale variable, and it sits on top of zero on the Y axis, so we add an offset to that as well.
Next we loop through all the faces on our model, and using the indices we stored earlier grab the corresponding three vertices. Because JavaScript arrays start with the first item at index 0 and the obj format starts at index 1 we decrease all indices by 1 to get the right vertex. If you don’t do this, the model will look very messed up. Then we check to see if all our vertices have an actual value, and print some debug info if something went wrong.
If all vertices look good we draw a line from vertex 0, to vertex 1, to vertex 2, and back to vertex 0. You might notice that we’re subtracting the vertices’ Y coordinates from the center Y coordinate, instead of adding them. That’s because in 3D space a bigger value for Y means the position is higher up, but we’re drawing in 2D space where a higher value means the position is actually lower, so we subtract the value instead of adding it. This isn’t a problem for now, and it’ll fix itself when we start doing proper 3D transformations later on.
Finally, we update our canvas with our new pixel data to see the results. And viola, we have a teapot!

Backface Culling
The astute among you might notice something doesn’t seem quite right. Every quad on the model is divided like a sort of X shape, into what appears to be 4 triangles. What is actually happening is that we’re drawing the model’s wireframe without backface culling, that is we are drawing the back of the teapot as well as the front, and they line up and overlap perfectly because of how the model is made, but the diagonal faces the opposite way, creating the X shape.
The lessons I was following saved backface culling for the 2nd lesson but I figured I’d get a head start and implement it straight away. Face culling relies on something called the polygon’s winding order; the clockwise or counterclockwise direction you get if you follow the order of the vertices inside the polygon on the screen from one, to the next, to the next, to the first. In OpenGL the convention is that if the order of vertices is counterclockwise, then we’re looking at the front of a polygon, if its clockwise then we’re looking at the back of a polygon and (unless specified otherwise by the programmer) we don’t need to draw it.
Unfortunately, this does involve some math. Feel free to skip most of the explanations below and skip straight to the code, but for those interested in understanding how to do it, I’ll explain. To figure out the winding order, we need to perform the following steps:
- Transform all the vertices to screen space.
- Calculate the cross product of two of the polygon’s edges.
- Check the Z component of the result to see if the polygon is front or back facing.
Since we’re not actually using 3D space yet, we can skip step 1, since we already have our screen space coordinates. Step 2 involves the cross product of two vectors, which takes two vectors and returns a vector which is at a right angle to both. If both vectors start at the origin (0, 0, 0) then the cross product becomes quick and easy to calculate. In JavaScript it’d look something like this:
function crossProduct(a, b) {
  return {
    x: a.y * b.z - a.z * b.y,
    y: a.z * b.x - a.x * b.z,
    z: a.x * b.y - a.y * b.x
  };
}
Given that we have our vertices in screen space, we know that X is the horizontal axis, Y is the vertical axis, and Z is the axis that points into and out of the screen. The X and Y axes aren’t going to tell us if we’re looking at the back or front, we want the axis that either points towards us, or away from us, to tell us if we’re looking at the polygon’s back or front. That means we don’t actually need the full cross product, but just the Z component, defined as a.x * b.y - a.y * b.x, which saves us a lot of calculations.
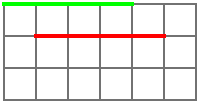
Unfortunately our vertices are not defined relative to the origin. Fortunately, it’s easy to fix that. Imagine a line from a point at (1, 1) to another point at (5, 1), the red line in the image above. If you subtract the former point from the latter point, you get a point that’s at (5-1, 1-1) or (4, 0) in space. If you then draw the green line from (0, 0) to (4, 0), you’d get the same line as the red one, just eminating from the origin instead of from somewhere else.
We can do the same with 3D points, and we happen to have three of them; our vertices. If we subtract our first vertex’s positions from the 2nd and 3rd, we get two vectors that describe the edges of our triangle, starting at the origin, which lets us do our cross product cheaply and easily. So if we define our vertices as v0, v1, and v2 in order we get the following:
a.x = v1.x - v0.x
a.y = v1.y - v0.y

b.x = v2.x - v0.x
b.y = v2.y - v0.y

z = a.x * b.y - a.y * b.x
z = (v1.x - v0.x) * (v2.y - v0.y) - (v1.y - v0.y) * (v2.x - v0.x)
You might notice we’re not calculating a.z or b.z, but that’s just because the calculation we’re doing doesn’t require those. If we try this out we wind up getting a negative value for Z if the vertices are counterclockwise, which lets us write our function as follows:
// returns true if vertices are in counterclockwise order
function isCcw(v0, v1, v2) {
  return (v1.x - v0.x) * (v2.y - v0.y) - (v1.y - v0.y) * (v2.x - v0.x) >= 0;
}
And we can add a call to this function to our drawing code to only draw polygons which are facing towards us:
    if (v0 && v1 && v2) {
      if (isCcw(v0, v1, v2)) {
        drawLine(imageData, centerX + v0.x * scale, centerY - v0.y * scale, centerX + v1.x * scale, centerY - v1.y * scale);
        drawLine(imageData, centerX + v1.x * scale, centerY - v1.y * scale, centerX + v2.x * scale, centerY - v2.y * scale);
        drawLine(imageData, centerX + v2.x * scale, centerY - v2.y * scale, centerX + v0.x * scale, centerY - v0.y * scale);
      }
    }
This section was very heavy on the maths, but if you don’t understand the cross product you can just use the code as provided or read more about the cross product on Math Is Fun.
Note: In an earlier version of this article I said that isCcw should return a negative value for front facing polygons even though OpenGL specifies that a negative Z value points away from us, into the screen. I argued that this was correct because our screen coordinates are reversed from OpenGL’s where 0 is at the bottom, and Y increases towards the top. This explanation would have been correct if the cross product we were calculating was the cross product of the screen coordinates, unfortunately I failed to recognize that we were passing it the model’s vertices, which do not have a flipped Y axis, and thus would function completely as normal. Oops?
End Result

And this is what our final result looks like. Not bad! Next we’ll be adding triangle rasterization and some other things. You can find the source code download and relevant links below, and if you liked this post maybe give it a share using one of the buttons below or check out options to support our work.